2024 shipping stock surprises – and a look at the ‘Monday curse’
With the latest year-to-date performance stats on dry bulk, container line, container-ship lessor and tanker stocks
Do shipping stocks really decline more on Mondays than on other days?
Whenever shipping stocks flash red across the board on a Monday, as they did yet again on March 4, the inevitable response among retail day traders on social media is: It’s because it’s Monday. There is a belief that, for whatever reason, shipping stocks fare poorly on Mondays.
This theory is not unique to shipping stocks. The idea that stocks, in general, do worse on Mondays than Fridays dates back to a 1973 study by academic Frank Cross, if not earlier. Other studies have disputed this theory.
What does the trading data show for shipping stocks?
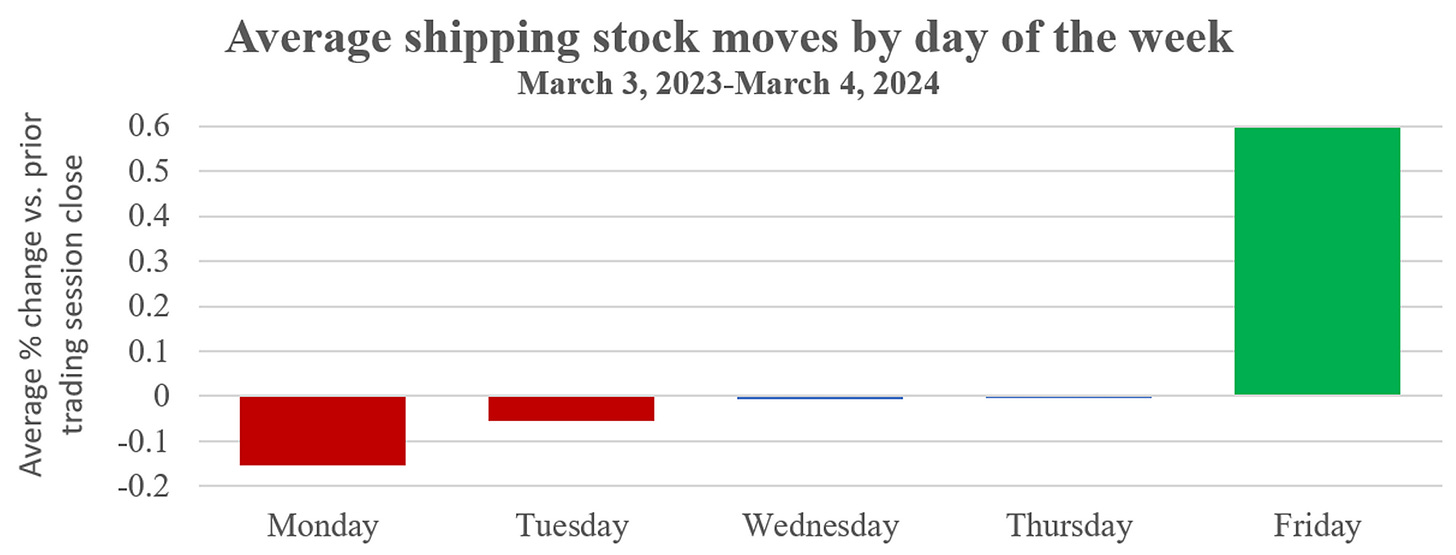
Inside Shipping calculated the average price changes by day of the week for 24 of the most highly traded U.S.-listed shipping stocks, based on the change in adjusted closing price versus the prior close over a one-year period from March 3, 2023, to March 4, 2024.
The result: Over the past year, for whatever reason, average daily returns on shipping stocks have indeed been worse on Mondays than any other day of the week, and significantly worse than on Fridays.
The average daily change in the 24 shipping equities (not weighted by market cap) was -0.15% on Mondays, versus a gain of 0.6% on Fridays. Average price changes were -0.05% on Tuesdays and flat on Wednesdays and Thursdays.
Among the five single trading sessions during the one-year period with the highest average gains, four landed on a Friday. The biggest takeaway from the past year’s trading data is Friday’s strength more so than Monday’s weakness.
2024 shaping up to be another year of surprises for shipping stocks
Ocean shipping stocks aren’t for the faint of heart. They entice with the promise of outsized returns, then maddeningly refuse to follow the script. Shipping rates are inherently volatile – they don’t go up or down in a straight line – and the stocks can slide for months at a time when the fundamentals say they shouldn’t. Or they can jump when they’re not expected to.
Just over two months into 2024, dry bulk, container and tanker stock moves are showing, yet again, how difficult they are to predict.
Dry bulk stocks
Larger bulk commodity vessels are known for sudden swings in spot rates. Case in point: what’s happening now with Capesizes, larger dry bulk vessels with capacity of around 180,000 deadweight tons that carry iron ore, coal, and – increasingly – bauxite.
The first quarter is notoriously terrible for Capesizes due to weather constraints on iron ore loadings in Brazil and Australia. In mid-February 2023, Capesize rates sank to a nadir of $2,200 per day, according to Clarksons data. The average breakeven at the time was $15,000 per day – Capesize owners were bleeding cash.
What a difference a year makes. Clarksons put average spot rates on March 4 at $34,900 per day, up 107% month on month and 59% above the current breakeven (they’ve since pulled back to $31,300 per day). Rates for midsize Panamax and Supramax bulkers are unexceptional; Panamaxes are at their five-average, Supramaxes slightly below their five-year average.
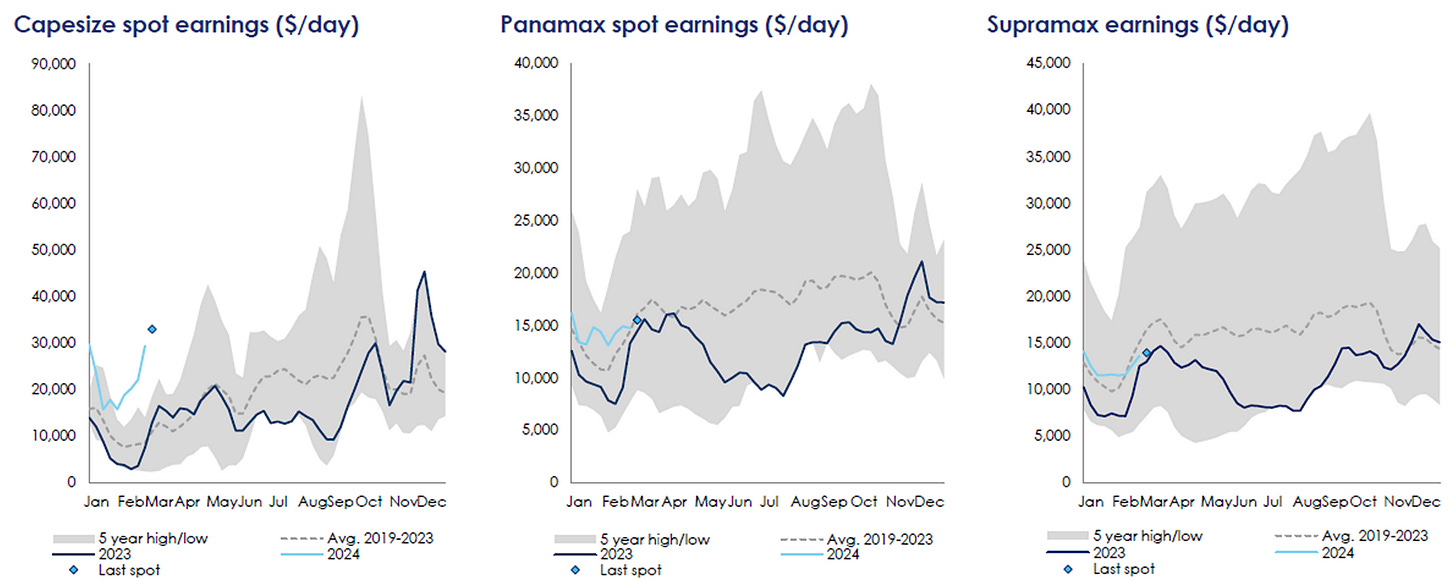
Part of the surprise Capesize spike is due to weather (it’s not raining as much as usual in Brazil) and part is due to the rising trade in bauxite, which is used to produce aluminum. In the past, the Atlantic Basin Capesize market was overwhelmingly driven by Brazil-to-China iron ore loads. Now, Guinea-to-China bauxite shipments are playing an increasingly role.
Bauxite exports from Guinea “have become a new structural trade in the Capesize segment,” said Lars-Christian Svensen, CEO of Golden Ocean (NASDAQ: GOGL), during a Feb. 28 conference call. The bauxite trade is also “inversely seasonal,” he explained. “The bauxite high season is in Q1, whereas Brazil [iron ore exports] traditionally enter a slow season in the same quarter. This year, due to dry weather in Brazil, we have seen both export routes active in large volumes.”
Dry bulk shipping stocks have had their ups and downs over recent years. They soared during COVID (2021 through mid-2022) as pandemic restrictions at Chinese discharge ports tied up bulker capacity. They languished last year after Chinese congestion cleared, releasing vessel capacity into the market.
Year to date, dry bulk stocks, particularly those with Capesize exposure, have performed better than equities in other shipping segments.
Shipowners with fleets heavy on Capesizes, like Golden Ocean, top the performance list. Also riding high: the Breakwave Dry Bulk Shipping ETF (NYSE: BDRY), an exchange-traded fund that buys near-dated dry bulk forward freight agreements (FFAs) to track spot rates, with a heavy emphasis on Capesize FFAs.

Container line stocks
Container lines face terrible supply-demand fundamentals due to record deliveries of new ships, yet geopolitical and weather wildcards have come to the sector’s rescue, at least temporarily. Longer voyages due to the Panama Canal drought and Houthi attacks in the Red Sea have pushed container freight spot rates back into the black.
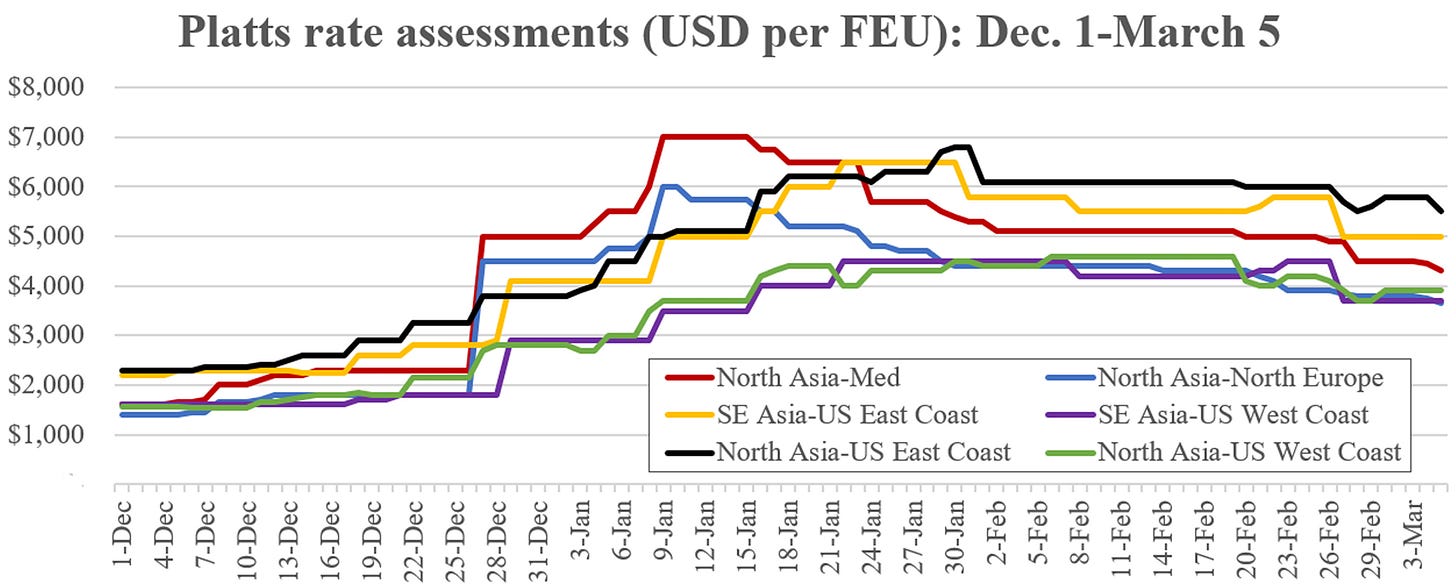
Assessments from Platts show that spot freight rates are down from the peaks in the wake of the Red Sea attacks, yet they seem to have stabilized at much higher levels than prior to the attacks.
Prevailing spot rates affect negotiations on annual contract rates, which account for the majority of the liner operators’ business. Asia-Europe contracts generally reset on Jan. 1, Asia-U.S. contracts on May 1. The Red Sea spot rate spike came too late to materially increase 2024 Asia-Europe contract rates, which had already been negotiated based on spot levels prior to Red Sea upside, according to Maersk.
However, the continued strength of spot rates is perfectly timed to boost 2024 Asia-U.S. contract rates. Those negotiations typically being during the TPM Conference, held this year on March 4-6.
The irony of the Red Sea attacks is that Houthi rebels were specifically trying to punish Israeli interests, and called out Israeli liner company Zim (NYSE: ZIM) by name – and they have done the opposite.
Zim’s trans-Pacific business is heavily focused on the Asia-East Coast lane. The Houthi attacks have pushed up spot rates in this lane just in time for Zim to negotiate higher annual contract rates, which should allow Zim to limit its predicted losses, or, according to at least one analyst (Jefferies’ Omar Nokta), turn a profit.
North Asia-East Coast spot rates were $5,500 per forty-foot equivalent unit (FEU) on March 5, 2.4 times levels on Dec. 1, prior to the Red Sea effect, according to Platts data. Southeast Asia-East Coast rates were assessed at $5,000 per FEU, 2.3 times Dec. 1 levels.
Liner stocks posted big gains in December due to Red Sea disruptions, however, that pricing support has faded even as spot freight rates have lingered at higher levels. Zim’s stock has given back much of its earlier gain, falling steadily since late January. As of March 5, it was only up 9% year to date, according to data from Kofyin (highlighting the extent of the recent pullback, it was still up 42% from Dec. 1 levels).
Other liner stocks are now down year to date, with Maersk faring worst, down 24%. Maersk’s stock sank following the company’s Feb. 8 conference call, when executives played down Red Sea upside and predicted a slump back to pre-attacks rate levels by year-end.

Container-ship lessor stocks
Container-ship lessors – also known as non-operating owners (NOOs) – have benefitted from disruptions in Panama and the Red Sea as well, although to a lesser extent than liner operators. These companies own container ships and lease them to liners, with revenues driven by charter rates.
Charter rates were expected to fall this year as liners took delivery of newbuildings and let their legacy charters expire. Instead, largely courtesy of the Houthis, charter rates have risen.
According to Global Ship Lease (NYSE: GSL), charter rates for container ships with capacity of 6,500-6,840 twenty-foot equivalent units (TEUs) averaged $27,000/day in February, up 4% from September; charter rates for 5,500- to 6,100-TEU ships averaged $25,000/day, up 4%; and rates for 4,000- to 5,470-TEU ships averaged $20,500/day, up 14%.
“Demand for large tonnage, including vintage units, is showing no sign of easing, which remains astonishing considering the continued influx of energy-efficient newbuilding vessels,” said Alphaliner in a March 5 report.
“The threat that newbuilding tonnage would destabilize the market has for now gone away, with the Red Sea problem greatly helping to absorb the new capacity,” Alphaliner continued. “Considering the ongoing shortage of prompt ships across the board and continued disruptions in the Red Sea, the short-term market outlook remains bright for NOOs.”
That said, U.S.-listed NOOs already had a high degree of their 2024 business locked in prior to the Red Sea-driven rate rise, courtesy of long-term charters inked during the supply chain crisis and in its immediate aftermath. Assuming disruption effects on charter rates are temporary, U.S.-listed NOOs have a limited opportunity to take advantage of the surprise strength.
Prior to the Red Sea attacks and heightened Panama Canal restrictions, Danaos (NYSE: DAC) had 90% of its capacity locked up on charters for this year, with Costamare (NYSE: CMRE) at 87%, GSL at 82% and Euroseas (NASDAQ: ESEA) at 70%.
With the exception of microcap Euroseas – which had the most exposure to disruption upside – stocks of container-ship lessors have seen only minimal gains, if any, due to the Red Sea and Panama Canal disruptions, likely due to their already locked-in charter coverage.

Tanker stocks
The tanker sector boasts the best fundamentals in shipping: extremely low newbuild deliveries for the current year, profitable rates, a tight supply-demand balance and upside from the Red Sea attacks and the Ukraine-Russia war. However, tanker spot rates are inherently volatile and they have not had a strong start in 2024.
Spot rate data from Clarksons shows that rates for midsize Suezmax crude tankers and smaller Aframax crude tankers have been on the decline since early January. They are now near their five-year average and well below rates at this time last year.
Spot rates for very large crude carriers (VLCCs) are faring better. VLCC rates have jumped in recent days, to $53,800 per day as of March 6 (for older, non-eco VLCCs). However, this is in line with the five-year average and 16% below VLCC rates at the same time last year, and brokerage Fearnleys reported on March 6 that “the upward charge is running out of steam.”
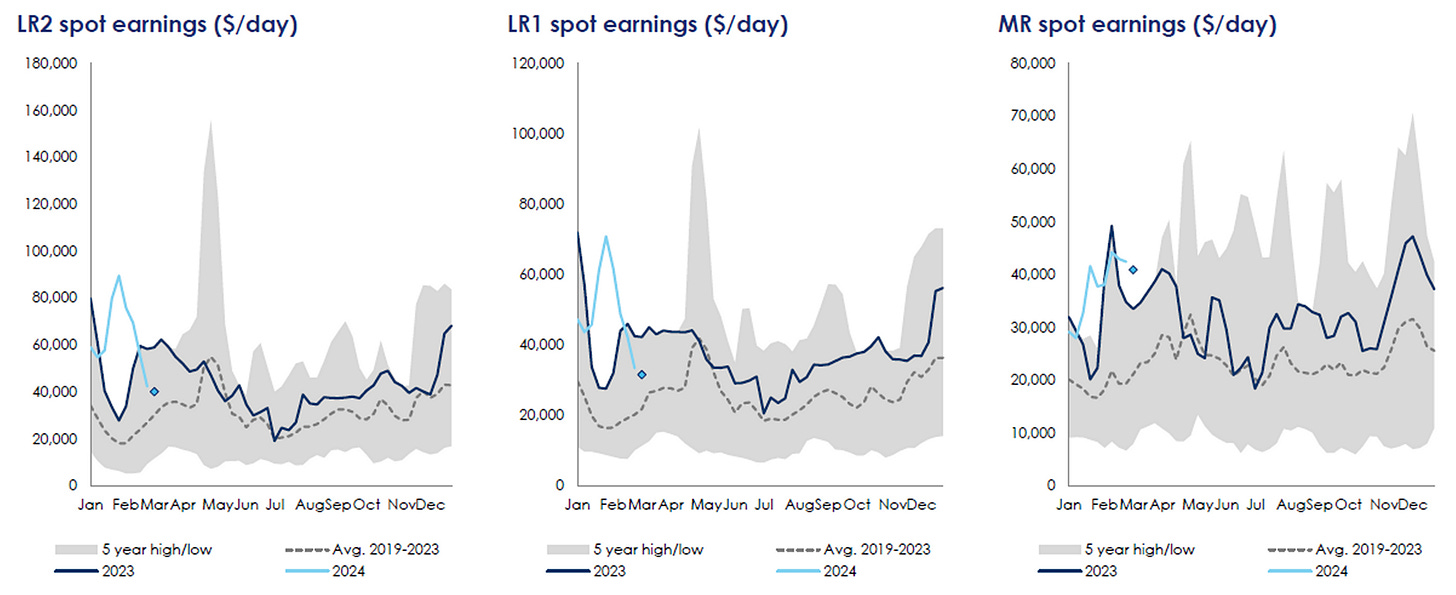
On the product tanker front, rates for non-eco LR1s and LR2s (larger vessels doing long-haul runs) have been falling since mid-January and are now down 30% and 35% year on year, respectively, according to Clarksons data.
MR (medium range) product tankers are outperforming, earning more per day than larger LR1s and LR2s that carry considerably more cargo. MR rates have risen year to date, and averaged $40,600 per day (for non-eco MRs) as of March 6, up 48% year on year.
Year-to-date performance for tanker stocks peaked in late January through mid-February, with performance sluggish ever since.
Owners with VLCC exposure are faring best in 2024. According to pricing data from Kpler, a top performer through March 5 was the Breakwave Tanker Shipping ETF (NYSE: BWET), an exchange-traded fund that buys tanker FFAs, heavily weighted toward VLCC FFAs. Other double-digit gainers included VLCC owners Frontline (NYSE: FRO), International Seaways (NYSE: INSW) and DHT (NYSE: DHT).
Trailing behind the VLCC owners are product tanker owners – including Ardmore Shipping (NYSE: ASC) and Scorpio Tankers (NYSE: STNG) – followed by Suezmax crude tanker owners such as Teekay Tankers (NYSE: TNK) and Nordic American Tankers (NYSE: NAT)
Nordic American Tankers, a popular stock among retail traders, is the outlier to the downside. Its shares were down 4% year to date through March 5, according to Koyfin data.

